This is a very old article written by me (around 2001, I guess) and it is just here for record.

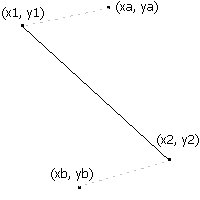
Cubic Bezier are nothing but curves. They are a very similar to lines, except that they are bent from both the sides. They are also drawn in almost the same method as lines are drawn. Like lines, they require 2 points for start and end of the curve plus 2 more which are known as control points. For example, in the figure you see a line drawn from (x1,y1) to (x2,y2). Cubic Bezier also needs these points plus two more which are called contol points. Let us now see what are those.
Cubic Bezier needs a total of four points. Two points represent the start and the end of the curve and the other two define the curve of the bezier. For example, in the figure beside, you can see that cubic bezier is just the same as a line with a start(x1,y1) and an end(x2,y2) point with a line between them. You can also see, two control points (xa,ya) and (xb,yb) which are attached to (x1,y1) and (x2,y2) respectively with a dashed line. These are the control points and the curve bends towards these points as you will see in the next figure.
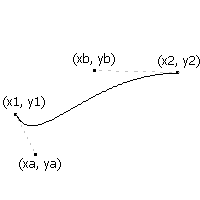
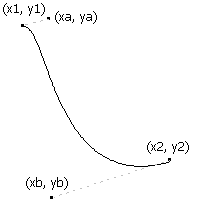
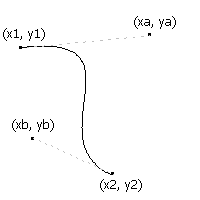
As you see now, the line from the previous figure from (x1,y1)-(x2,y2) is now a cubic bezier with control points (xa,ya) and (xb,yb). The bezier starts and ends at the same points as in the previous line except for that it is now bent towards the control points. As you can see, the starting point(x1,y1) of the line directs the line to curve towards (xa,ya) and end point(x2,y2) of the line directs the line to curve towards (xb,yb). The line which was straight in the previous figure is now curved because of two more control points. This is a cubic bezier. Check some more examples of such curves below.
Now, let’s see how to draw these beziers in a program. You have to use a formula which defines a cubic bezier. We know that there is a formula defining a line. That formula is called as linear formula since it is of degree 1 and hence draws a line. For cubic bezier curves, the equation has a degree 3 and plotting on it gives a cubic bezier curve. For drawing a cubic bezier, we need to loop through this formula with two values. Let us call them v1 and v2. In the loop, we change v1 from 0 to 1 in small increments. These increments mark the smoothness of the curve. In the loop, we set v2 to be 1 - v1. I will show you a code piece that will incorporate that formula too.
Programming code (Basic)
FOR v1 = 0 TO 1 STEP .01
v2 = 1 - v1

x = (x1 * (v2 ^ 3) + (3 * xa * v1 * v2 * v2) + (3 * xb * v1 * v1 * v2) + (x2 * (v1 ^ 3))

x = (y1 * (v2 ^ 3) + (3 * ya * v1 * v2 * v2) + (3 * yb * v1 * v1 * v2) + (y2 * (v1 ^ 3))
  drawpixel(x, y)
NEXT
The code can be easily adapted to any other language. The formula remains the same. You calculate both x and y in different formulae. You can generalise the formula and write like this:
point = (P1 * v23) + (PA * v1 * v22) + (PB * v12 * v2) + (P2 * v13)
where P1 = (x1,y1), P2 = (x2,y2), PA = (xa,ya), PB = (xb,yb) and point = (x,y) where you plot the pixel. But, you need to do some other extra work before you define something like this. So, this is a general formula just for representation purposes. In this, if you substitute for x and y in each of P1, P2, PA and PB, you get the formulae shown in the code.
One more note: The step value shown in the code is 0.01. This will produce a cubic bezier curve with 100 points. If you want more or less points, you can change this value. For example, say you need 50 points, then the step should be 1/50 or 0.02.


